
 Science Worksheets
Snowfall Tracking Project
|
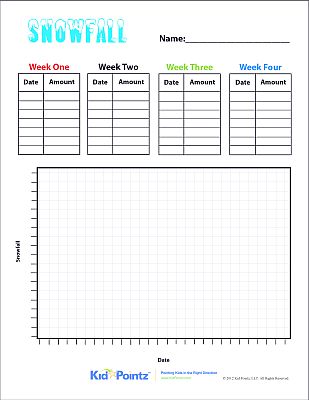
Even the slightest hint of snowfall is enough to cause a lot of conversations about how much there will be and how long it will last. The Snowfall Tracking Chart features blue letters that are topped with an icy design to match the cold weather and precipitation of the winter season along with a line for recording a name as well as plenty of spaces for up to four weeks of recording snowfall totals with each week designed using different colors to make them stand out on the page. Each week on the chart is divided into sections to record the date of when it snows and the amount. At the bottom of the page, there is a graph for plotting the details of snowfall amounts from each week. They can be recorded in any color and then connected to see which weeks had the most snowfall and which ones had the least amount with details for the date are shown across the bottom of the graph with the snowfall totals listed on the side to make plotting as easy as possible. The chart can be customized with any color and can be used year after year to see if any changes can be detected.